Fishbone Diagram
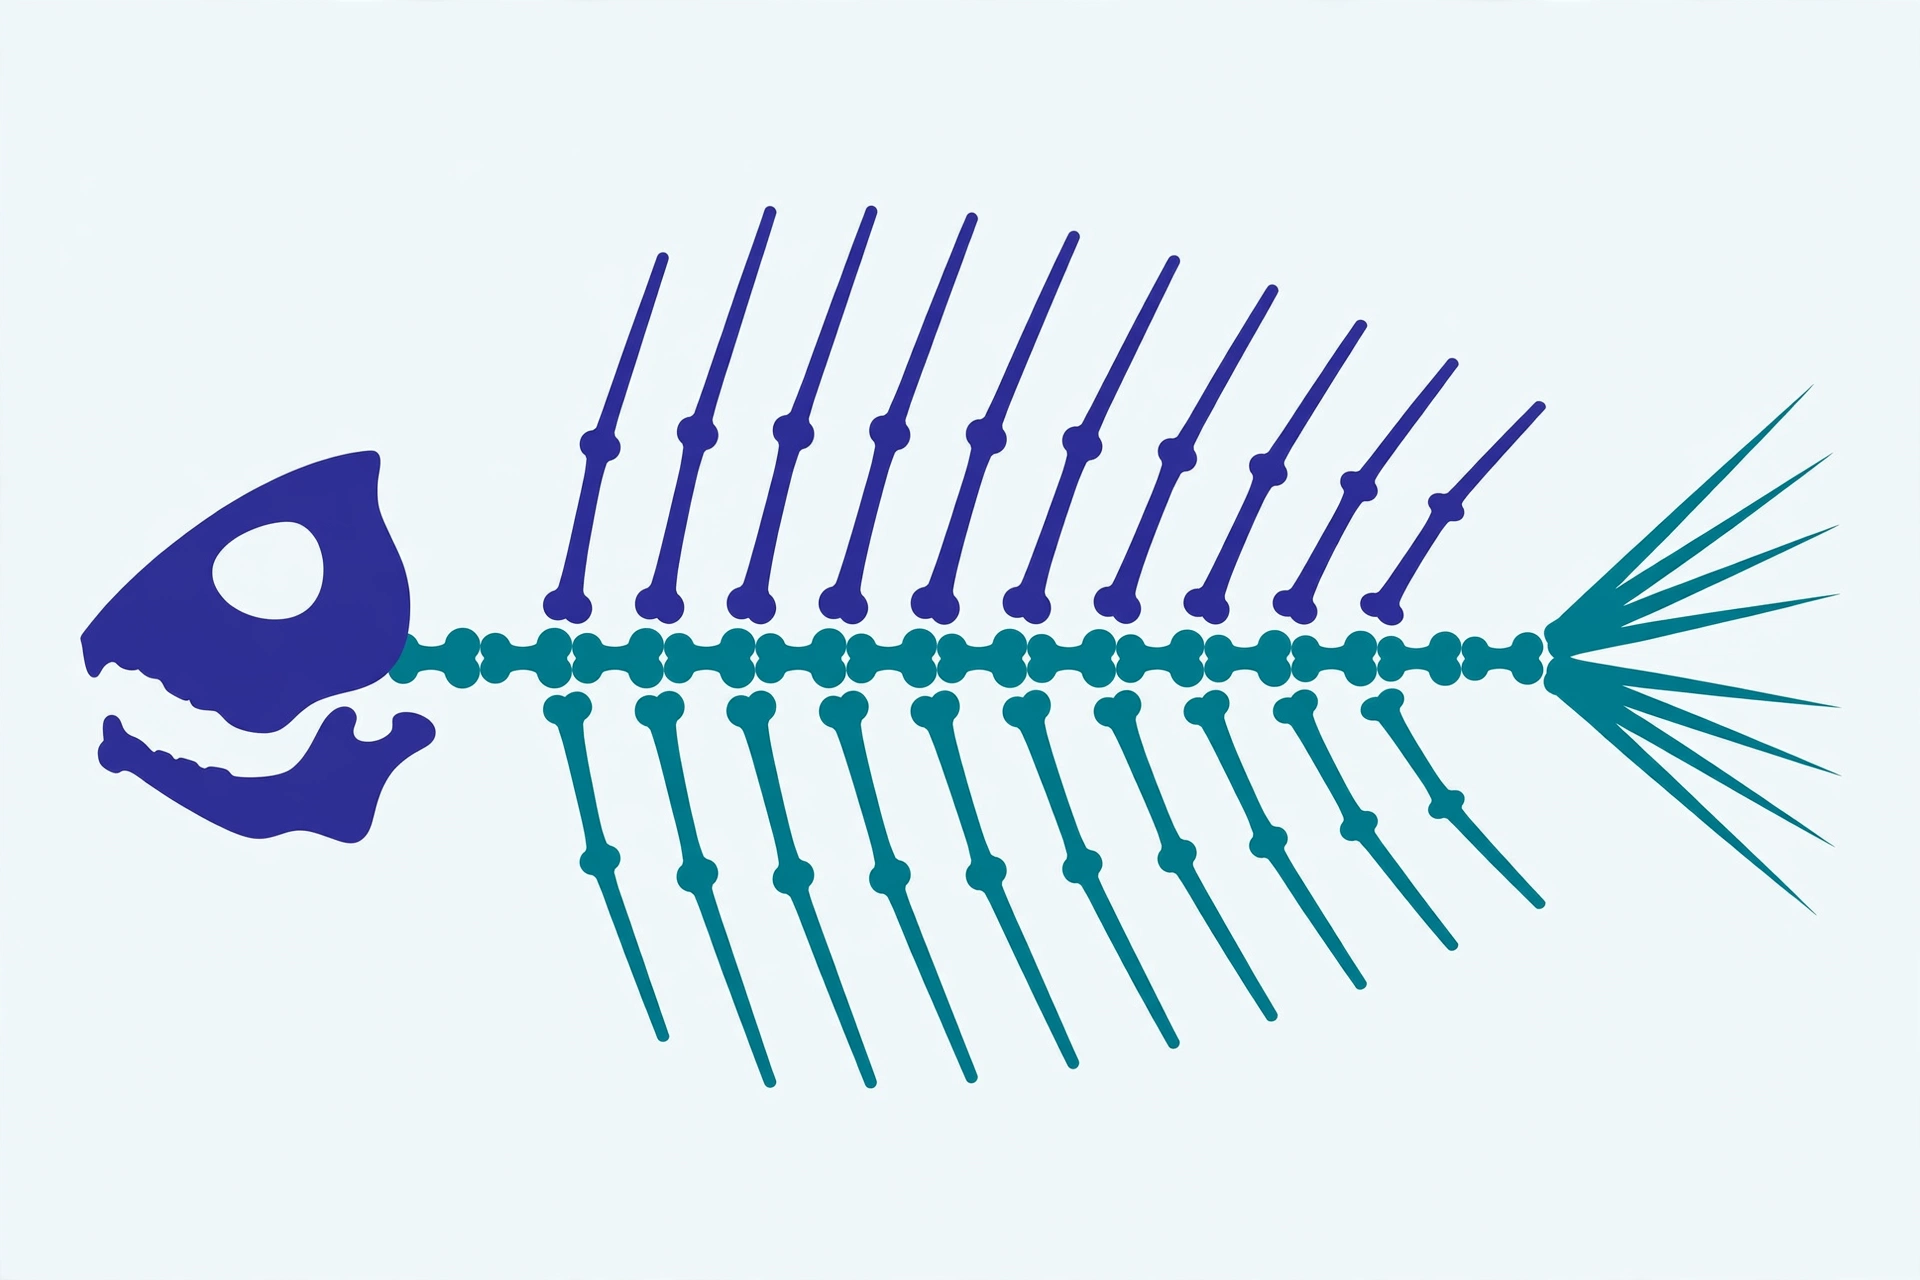
The Fishbone Diagram (Ishikawa Diagram) visualizes problems as a fish skeleton: the head pins the symptom, the bones branch into every possible cause by dimension. It forces teams to list all suspects before acting — a staple of Six Sigma and TQM.
What It Is
The Fishbone Diagram — also known as the Ishikawa Diagram or Cause-and-Effect Diagram — is a visualization tool that draws "effects" and "causes" in the shape of a fish skeleton: the fish head states the problem to solve, and the bones branch out into layer upon layer of possible causes. Its greatest power is forcing a team to list every suspect cause completely, before anyone starts acting — especially in messy situations where "the problem could be anywhere."
Origins and Key Figures
The fishbone diagram was invented in the 1960s by Japanese quality scholar Kaoru Ishikawa. He observed that factory quality problems rarely had a single cause; instead, people, equipment, materials, methods, and environment intertwined. He turned "brainstorming causes" into a picture: the spine is the problem, the big bones are dimensions, the small bones are specific causes.
It later became a standard tool of Six Sigma and Total Quality Management (TQM), traveling from Toyota's factory floors to today's internet companies. Ishikawa himself became known as the "father of Japanese quality control."
How to Use
- Pin the problem on the fish head — be specific: Write the problem as an observable phenomenon, not a guess. Write "November churn rose from 5% to 9%," not "users don't like us anymore."
- Draw the big bones — set your dimensions: The classic set is People, Machine, Material, Method, Environment, Measurement ("6M"), but adapt freely — internet products often use Product, Tech, Operations, Marketing, External. Keep it to 4–6 dimensions; more gets scattered.
- Brainstorm and fill the small bones: For each dimension, the team takes turns naming every possible cause — no judging, no rebuttals; completeness first, accuracy later. Small bones can branch further into finer causes.
- Vote to name the suspects: Once causes are listed, the team votes or scores to shortlist the 3–5 most suspicious ones. This is the pivotal turn from divergence to convergence.
- Verify each one with evidence: Find evidence for every high-suspect cause — check data, read logs, run experiments. A cause without evidence, however suspicious, remains a guess.
- Act and follow through: Build countermeasures for verified causes, with owners and success metrics. A fishbone diagram isn't done when the drawing is finished — it's done when the causes are eliminated.
Case Study
Background: A fictional case. "WhiteWhale" is a fresh-food e-commerce company. Over one quarter, stockout rates at its East China warehouse climbed from 2% to 7%, and support complaints doubled. Everyone had a theory: purchasing blamed unstable suppliers, warehousing blamed inaccurate system inventory, fulfillment blamed slow picking.
Diagnosis: The operations lead gathered all three departments to draw a fishbone. Fish head: "East China warehouse stockout rate 7%." Five big bones: People, Systems, Suppliers, Process, External. Brainstorming produced 23 small-bone causes; voting locked in three prime suspects: ① the replenishment algorithm's safety-stock parameter was outdated (systems); ② temp workers had high picking error rates during sales events (people); ③ a key supplier's lead time had lengthened without notice (suppliers).
Action: Each was verified separately. Data confirmed: the safety-stock parameter dated from before last year's sales event and couldn't keep up with current volume; temp workers' picking error rate was 4× that of full-timers; supplier lead time had stretched from 3 to 5 days while the contract was never updated. Countermeasures: recalculate safety stock with monthly reviews; add 2-hour training plus buddy checks for temps in their first week; renegotiate the SLA and add delivery alerts.
Result: Two months later, the stockout rate fell back to 2.5%, and support complaints dropped 60%.
Retrospective: Had they listened only to purchasing, all resources would have gone into switching suppliers — treating the symptom. The fishbone's value is "list everything first, then focus": of 23 causes, only 3 were the real culprits, but without drawing them out, nobody knew which 3.
Strengths and Limitations
Strengths: The fishbone's greatest strength is preventing omissions. Its structured dimensions force teams out of their silos — the blind spots where tech only sees tech and ops only sees ops have nowhere to hide. And the bar is delightfully low: a whiteboard and a marker are enough to start.
Limitations and boundaries: The fishbone has clear boundaries. First, it only lists suspects — it doesn't convict. Every cause must be verified with data afterward, or the diagram is just a collection of guesses. Second, it assumes causes are relatively independent; when problems come from complex interactions (like organizational culture), the fishbone feels clumsy. Third, wrong dimensions lead astray — choosing dimensions deserves real thought.
Risks and mitigation: The most common risk is "a beautiful diagram that nobody acts on" — analysis divorced from action. Mitigation: set the rule while drawing — every high-suspect cause gets a verifier and a deadline; every verified cause gets a countermeasure and an owner. Another risk is brainstorming turning into finger-pointing. Mitigation is the same as RCA: discuss causes, never names.
Common Questions
Q: Must the dimensions always be the classic 6M (People, Machine, Material, Method, Environment, Measurement)?
A: Not necessarily. How to choose: manufacturing fits 6M best; internet products can use Product, Tech, Operations, Marketing, External; support issues can use People, Process, Systems, Policy. The bar: every possible cause should fit into at least one dimension, with no overlaps and no gaps (MECE).
Q: We listed dozens of causes — what next?
A: Converge. Actionable advice: ① deduplicate and merge — combine different wordings of the same idea; ② team vote, 3 votes each, for the most likely and highest-impact causes; ③ the top 3–5 enter verification. The key move: don't try to verify 20 causes at once — resources won't stretch; focus produces results.
Q: How does the fishbone relate to the 5 Whys?
A: They're complementary. How to use them: the fishbone spreads horizontally — laying out possible causes across dimensions; the 5 Whys digs vertically — drilling a locked-in suspect down to its root. The standard play: fishbone first to diverge and converge, then 5 Whys on the top causes to reach root causes.
Q: How do we draw one in a remote meeting?
A: Tools aren't the issue. Actionable advice: use an online whiteboard (Miro, FigJam) or a shared doc, with everyone adding causes simultaneously; the facilitator groups them into dimensions and keeps the pace; vote via poll or show of hands. The bar: if half the room stays silent throughout, the session failed — the fishbone's power comes from collective intelligence, not a few soloists.
Recommended Resources
- Kaoru Ishikawa's *Introduction to Quality Control*: the inventor's own explanation — slim volume, half a day to read.
- *Six Sigma* (Michael Harry): the standard use of fishbone diagrams in the DMAIC process.
- The ASQ (American Society for Quality) cause-and-effect guide: free online, with cross-industry examples.
Related Methods
Core Quote
An incomplete list of causes makes countermeasures a gamble; a well-drawn fishbone leaves problems nowhere to hide.